

Telecom Users Churn Machine Learning Model Workflow
Using Machine-learning and Data Science libraries in an attempt to build a ML model capable of identifying whether or not people will churn.
I am Machine learning enthusiasts currently deep diving into TensorFlow , Convolutional Neural Networks and NLP's.
I write blogs to keep track on my projects so that I know every detail of it and keep learning new things with sharing the knowledge I gain in the process to everyone.
Any business wants to maximize the number of customers. To achieve this goal, it is important not only to try to attract new ones, but also to retain existing ones. Retaining a client will cost the company less than attracting a new one. In addition, a new client may be weakly interested in business services and it will be difficult to work with him, while old clients already have the necessary data on interaction with the service.
Accordingly, predicting the churn, we can react in time and try to keep the client who wants to leave. Based on the data about the services that the client uses, we can make him a special offer, trying to change his decision to leave the operator. This will make the task of retention easier to implement than the task of attracting new users, about which we do not know anything yet.
This blog is Part 1 of 2
The problem which is solved in this blog is actually from :
By - Radmir Zosimov
1. Problem Definition :
Statement :
The task is to analyze the data and predict the churn of users (to identify people who will and will not renew their contract).
Churn :
Churn is a measurement of the percentage of accounts that cancel or chose not to renew their subscriptions.
Churn is the measure of how many customers stop using a product. This can be measured based on actual usage or failure to renew (when the product is sold using a subscription model).
2. Data :
The data we are using comes from -> Kaggle
3. Evaluation :
If we can reach maximum accuracy at predicting whether or not a customer will renew his subscription.
4. Features :
- customerID - customer id
- gender - client gender (male / female)
- SeniorCitizen - is the client retired (1, 0)
- Partner - is the client married (Yes, No)
- tenure - how many months a person has been a client of the company
- PhoneService - is the telephone service connected (Yes, No)
- MultipleLines - are multiple phone lines connected (Yes, No, No phone service)
- InternetService - client's Internet service provider (DSL, Fiber optic, No)
- OnlineSecurity - is the online security service connected (Yes, No, No internet service)
- OnlineBackup - is the online backup service activated (Yes, No, No internet service)
- DeviceProtection - does the client have equipment insurance (Yes, No, No internet service)
- TechSupport - is the technical support service connected (Yes, No, No internet service)
- StreamingTV - is the streaming TV service connected (Yes, No, No internet service)
- StreamingMovies - is the streaming cinema service activated (Yes, No, No internet service)
- Contract - type of customer contract (Month-to-month, One year, Two year)
- PaperlessBilling - whether the client uses paperless billing (Yes, No)
- PaymentMethod - payment method (Electronic check, Mailed check, Bank transfer (automatic), Credit card (automatic))
- MonthlyCharges - current monthly payment
- TotalCharges - the total amount that the client paid for the services for the entire time
- Churn - whether there was a churn (Yes or No)
Now once you are ready with your Jupyter Notebook let's dive into the project.
5. Codes :
Getting our data ready :
In Every Machine Learning Project the first and one of the most important step is getting our data ready to train our model on it.
The data we might use may contain unusual data-types which are model won't be able to process so, we have to convert it into something it understands. To help us out of this we can convert our object dtype (data-type) into something like categories and then these categories can be turned into float64 & int64 to be processed.
We will be using some functions to help us, as you go further you would find it.
The libraries which we need for this project to get our data ready are :
pandas, numpy, matplotlib.pyplot, sklearn
Let's also visualize our data at the same time to know how it looks :
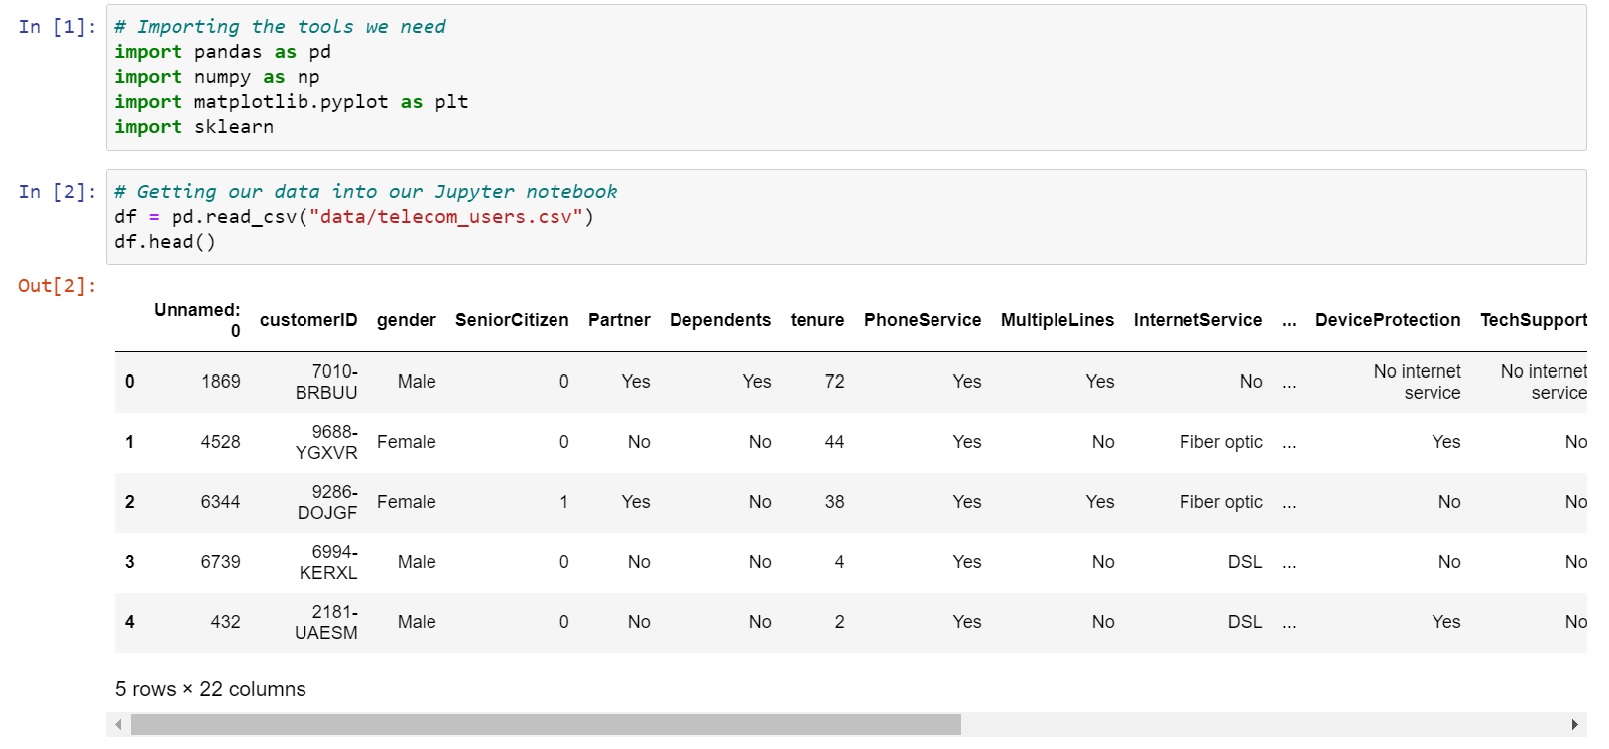
Observation is very important when working with data. If you look closely in the above image you would find we have an unnecessary column which we need to get rid of.
df = df.loc[:, ~df.columns.str.contains('^Unnamed')]
The above function helps us in accomplishing our task. Have a look.
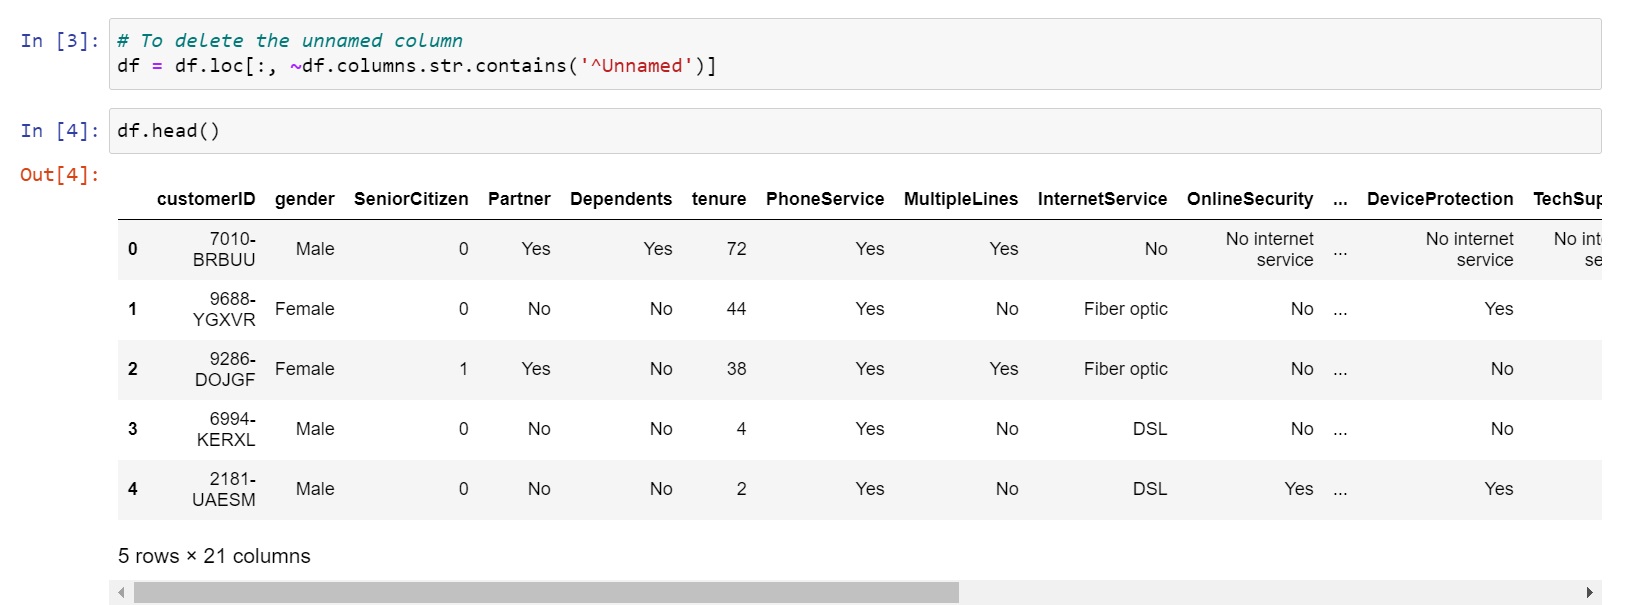
Now as our un-wanted column is out of our data let's move forward and get some insights on our modified data.
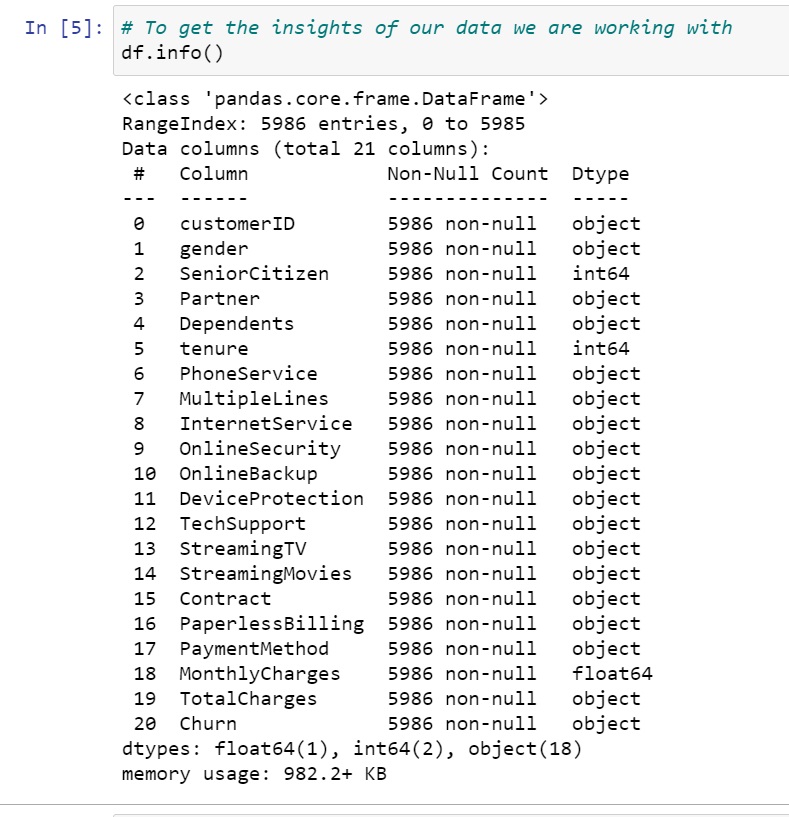
So. you can see the dtype of most of data is object and we know our model won't be able to process it so you know what we will be doing.
Converting object to categories
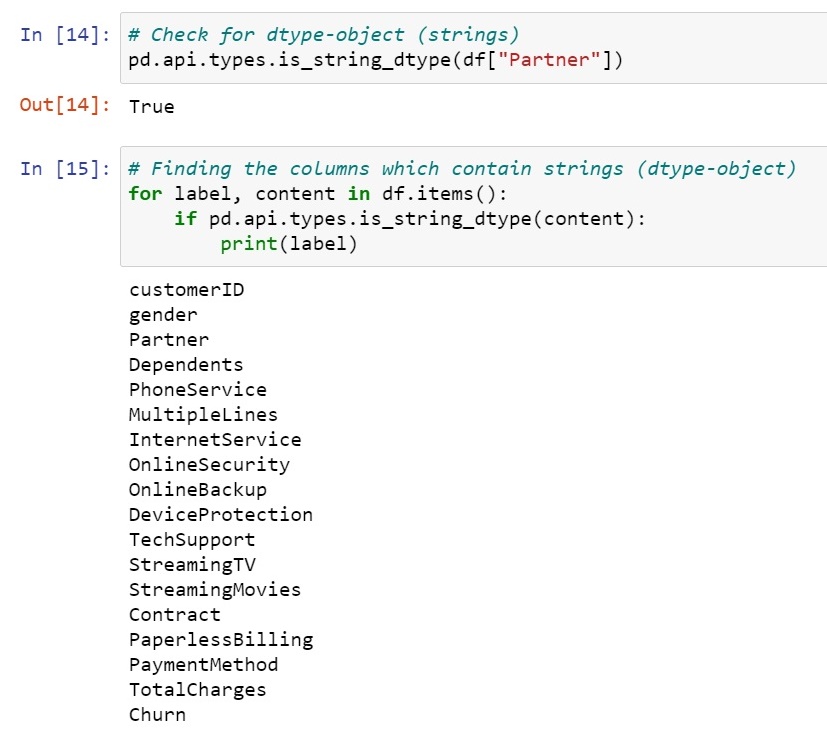
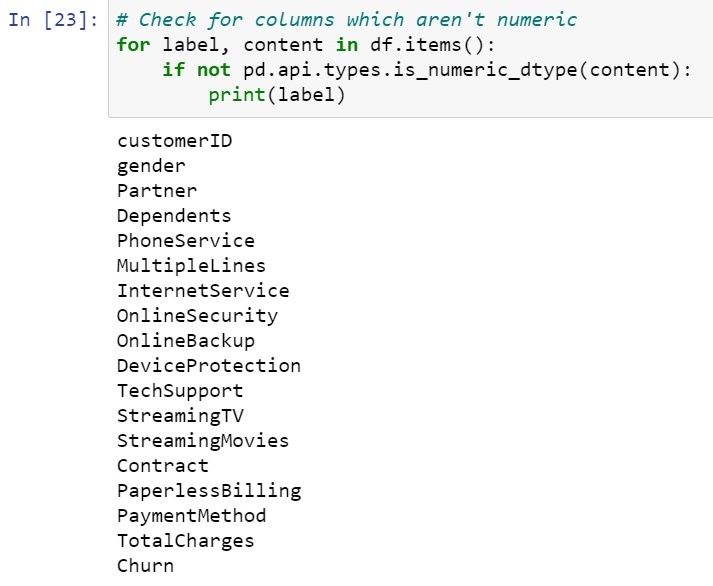
This function helps us determining whether our column is an object (string):
pd.api.types.is_string_dtype(df["Partner"])
If this results in True -> we need to change the dtype of this column.
Finding this individually typing would be more time consuming lets do this with this simple for loop
Now as we know what labels we have to convert into categories let's move ahead with it and convert all of the object to category.
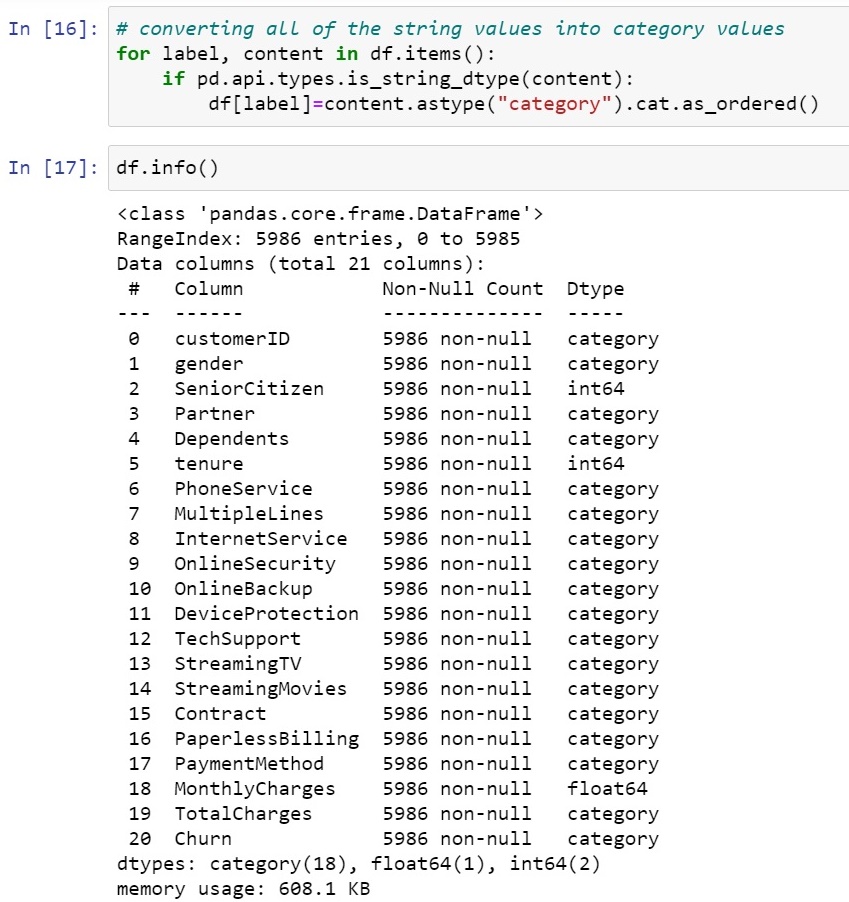
Now, as our object are converted to categories, let's move forward and convert these categories into special codes which are nothing but integer values.
The values which need to be converted are :
This helps our model to process well on the non-numeric data. We will turn all the category dtype to int8 with help of a for loop as shown.
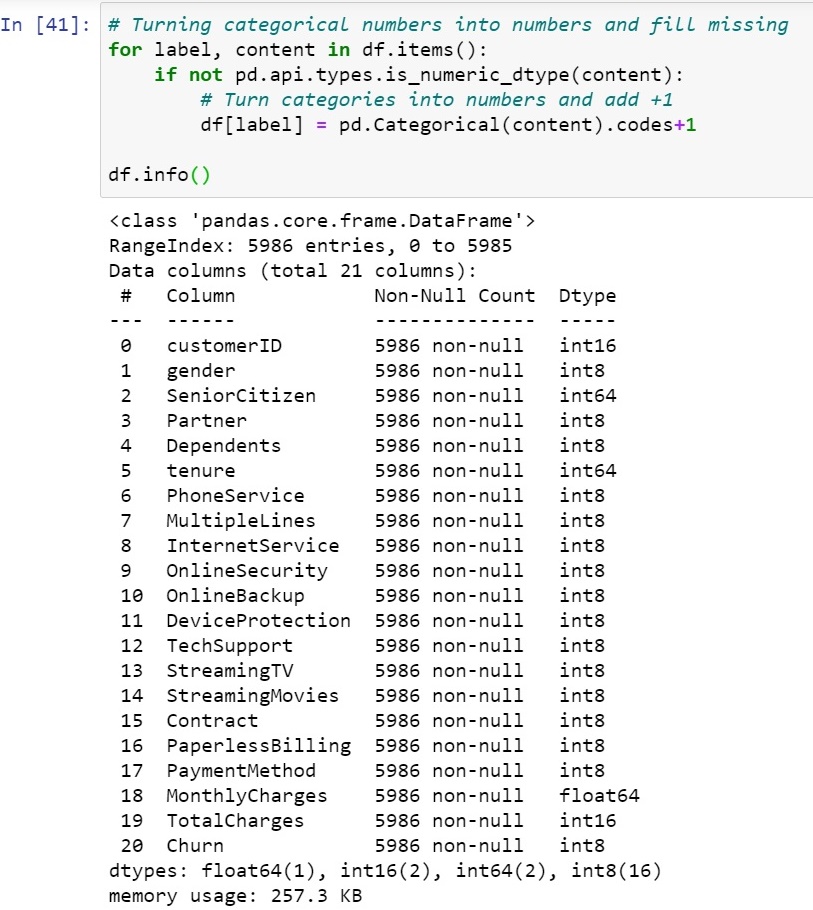
Great! the data is converted into dtype int8 as shown in above image.
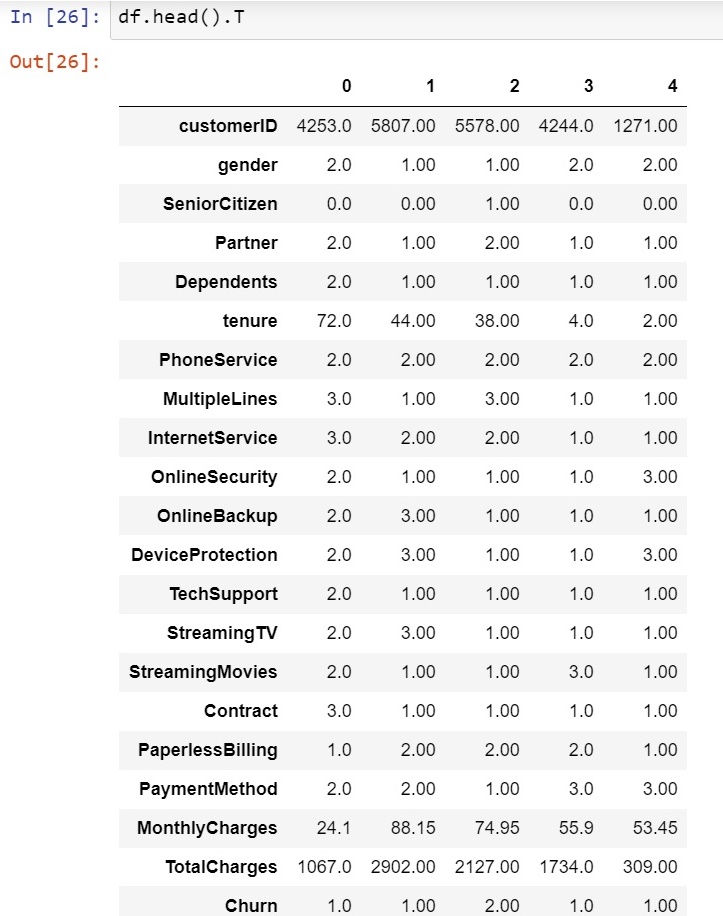
Let's see how this integer -> int8 values look into our data :
Phew! It was a lot of code, now our data is converted into the required format and we can use it to train our Machine Learning model and predict our results on it.
Modelling
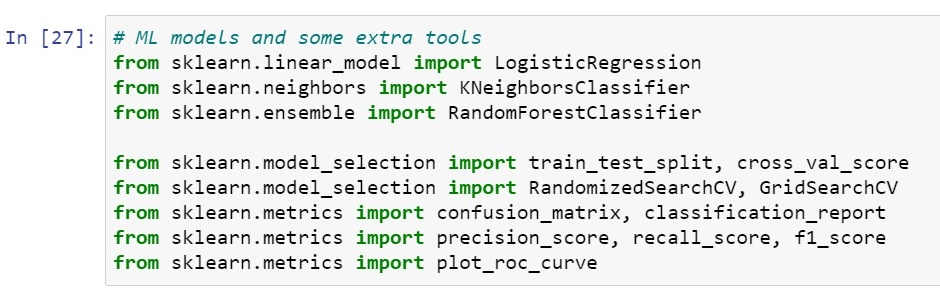
To begin with we need some of the libraries imported to our working space let's get them:
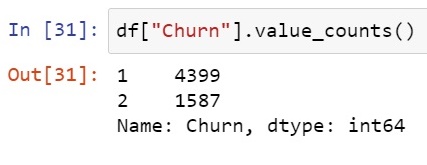
Before beginning let's once have a look into how are to be predicted values are distributed.
1 -> Not Churn
2 -> Churn
Fine, so now we are done with getting our data ready and all of the remaining steps. So let's dive into training our Machine Learning model.
To get better results we will be trying 3 different models from the sklearn library:
LogisticRegression()
KNeighborsClassifier()
RandomForestClassifier()
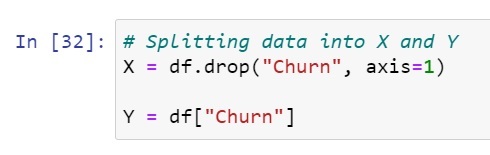
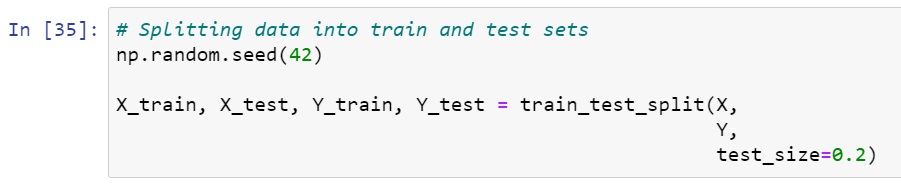
Let's move ahead with splitting our data into training and test sets:
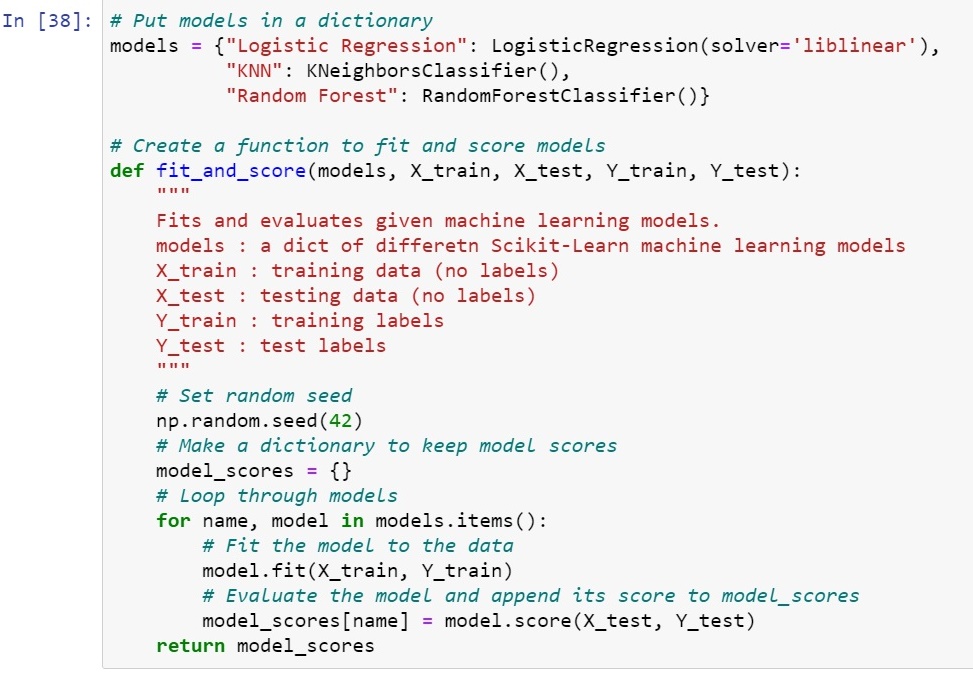
To train our models we will use a function so that it becomes a bit easier for train as well as score our model.
Before defining this function we will create a dictionary to store name of our model and our model itself.
This function which we are defining will take one model at a time from our created dictionary which we named -> "models". It will create another dictionary named "model_scores" to store the scores of each model.
It will run a for loop to train ->fit() and score ->score() for each model.
As shown below :
Now, since our models are trained and they have scored some value on the data let's see them :
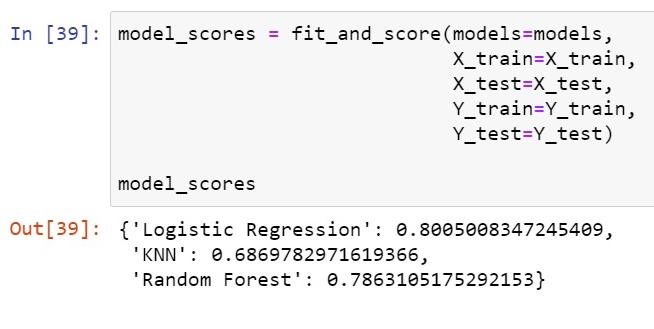
Woah! so LogisticRegression() over-performed over other 2 models.
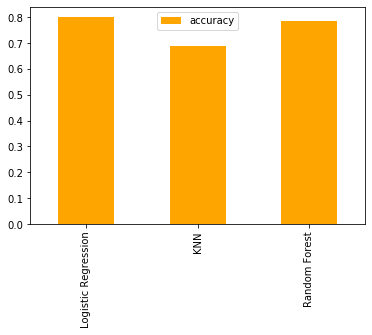
Let's get this data visualized in form of a bar graph.
After all this lets see how we can improve our models and analyse them more efficiently
Also have a look on :
- Hyperparameter tuning
- Feature Importance
- Confusion Matrix
- Cross-Validation
- Precision
- Recall
- F1 score
- Classification Report
- Reciever Operating Characteristic curve (ROC)
- Area under the curve (AUC)
Trying to tune our models with RandomizedSearchCV() and GridSearchCV()
So stay tuned and follow me on social-media listed.